Easel.ly allows you to create infographics that visually display statics, maps, charts and more in a creative way. Check out the website to see an example.

How to Make an EASEL.LY
- Go to http://easel.ly/ and create a free account.
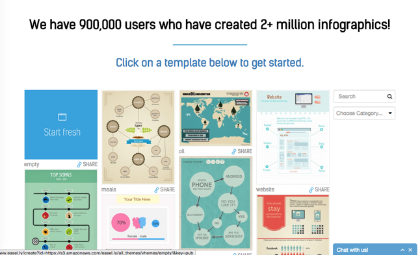
- Click “Start Fresh”, or choose a premade template by clicking on any of the templates!
- On the top toolbar, there are buttons to add objects, backgrounds, shapes, text, and charts. Clicking the chart button will give you many options for what type of chart you want.
- Drag the chart of your choice onto your template. Double click a chart to edit it. Enter or import data to make the chart.
- Rearrange your infographic by clicking and dragging each section to a new area on your infographic.
- Click on the Vhemes button in the top left corner to change the theme of your flyer.

- When you are done, click “Save” at the top of the page. Then, click “download” to save as PDF or click “Share” to copy the embed code.

Adding an EASEL.LY Infographic to an ePortfolio
- After you click “Share,” click the embed code.

- Copy the "Embed Code".
- Login to TaskStream and select the Folio/Web Page that you wish to edit.
- Select the area in the left hand navigation panel where you would like to include your infographic.
- Click “Text & Image” in the Add bar at the bottom of the page.
- Click “HTML/Source” in the upper left hand corner of the toolbar.

- Paste the embed code for your infographic.
- Click “Save and Return” and your infographic will be embedded!