
Math Students present Research: Gene-Network Analysis Tool
Congratulations to Larry Kalesinskas (Biostatistics Minor) and Evan Cudone (Math Major) for presenting their research, "GxA: Developing a Gene Expression Network Visualization and Analysis Tool" at the annual Maize Inflorescence Project Meeting and at the St. Albert's Day Research Symposium held at the Stritch School of Medicine. They spent the summer developing a tool to help visualize and explore complex biological networks to aid in the analysis and discovery of biological pathways. Evan and Larry are senior Bioinformatics majors, as well as being a part of the Math Department. We sat down to ask Larry some questions:
Q: What exactly does your tool do?
A: Our tool takes gene expression data across tissues (which tells us at what level genes are being expressed in respective tissues) and compares every gene against every other gene in an organism, correlating them. If genes are similarly expressed across several tissues (and thus highly correlated), they are likely to be part of the same biological pathway, so we represent them in a network: 2 nodes for the genes with an edge connecting them. This network can help scientists discover how genes interact, enlighten us on how different biological pathways work, and how all these different pathways in an organism are connected. GxA is an interactive, dynamic and fast tool to accomplish this.
Q: What role did Math play in developing this tool? Which Math classes have helped you develop this?
A: The basis of our tool hinges on Statistics and being able to understand various parametric and non-linear methods of correlation. GxA allows the use of Pearson, Spearman and a measure called Mutual Information to correlate genes and generate the network. In fact, we even talked to Dr. O'Brien to fully understand and implement these methods of correlation. After this, we also use heuristic algorithms to cluster and analyze our networks, all based on math.
Q: What challenges did you face in developing this tool?
A: Computationally, this tool was very challenging to create, due to the massive amount of genes an organism has. If we try to correlate 40,000 genes (the size of a maize genome) all against each other, we have to do 1.6 billion calculations. We developed methods to cut down on the number of calculations we have to do, as well as store all of the data not required for visualization in SQL databases, allowing this to be run on a common computer. Further, although we were both experienced coding in Java, we coded GxA in a Java framework called Cytoscape and had to basically learn a new language to create the software.
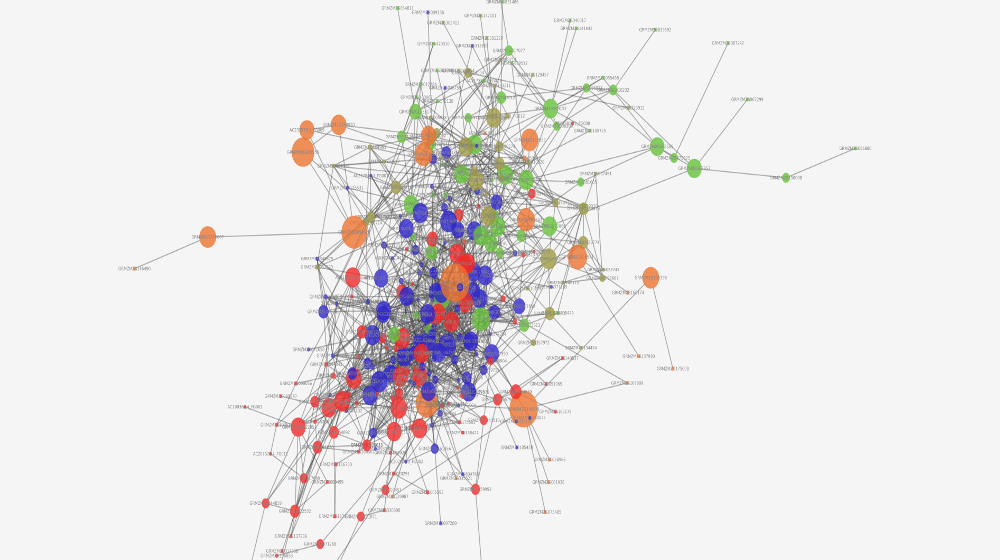
Q: Can you show us a conclusion you can generate from the network?
A: Sure! So, our software generated the image above. There is a giant orange node in the center, which is sized this way because it has a high betweenness centrality measure (aka: it is the node with the largest number of shortest paths from all vertices to all others that pass through that node). This node is super connected, so the gene, theoretically, should be super connected. Turns out, it is. The gene codes for a protein called RBAP1, which is a regulatory protein for the cell cycle and a tumor suppressor protein, which explains the high degree of connectivity.
Q: How did you get involved with research originally?
A: We both started as part of Dr. Putonti's lab here at Loyola sophomore year and then reached outwards - expanding to work for Dr. Dong at the Center of Biomedical Informatics, as well as other research labs at the Stritch School of Medicine (Evan) and the Rehabilitation Institute of Chicago (Larry).
Q: What are your plans for the future?
A: Both Evan and I are currently applying to Doctoral Programs in Computational Biology and Biomedical Informatics and hope to continue on with biology-oriented modeling and computational research.